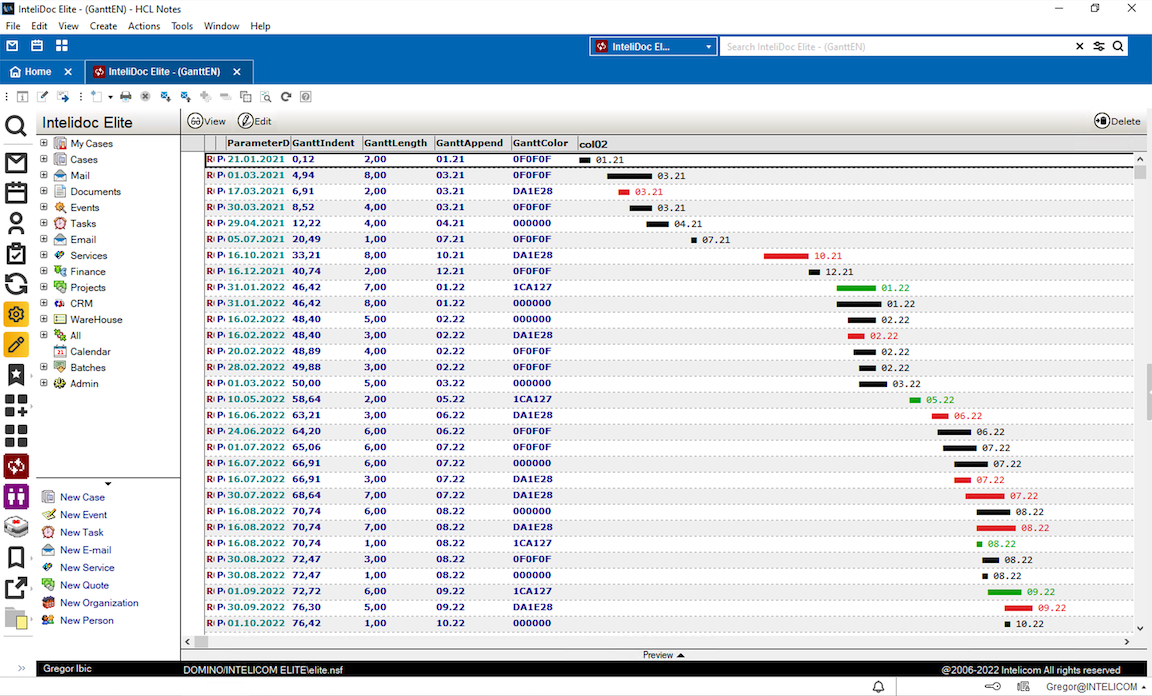
Gantt diagram inside HCL Notes application
Gantt diagram inside HCL Notes issue has been scratching me for a very long time. Developing project management applications always rise questions about gantt diagrams. And doing gantt diagrams in HCL Notes it is not an easy thing. We tried before with integrations with Xpinc (xpages in notes client) but it was not a success story. Embeded web browser in Notes was outdated and it was not easy to make it perform reliable and also to integrate with HCL Notes authentication. Java applets are also difficult to maintain on client side. So we postpone Gantt diagrams for a while.
Implementing Intelidoc at new customer site again raised same question: Can we have a Gantt diagram here? It was time do to something. I re-searched for our past development and web sites that had same conversation years ago. Surprise, surprise, some of them are not active anymore. This is a problem of Internet, it forget usable stuff too quickly. Eknori https://www.eknori.de was a good refresh of topic.
Ok, let’s start with our solution.
What we need - requirements:
- draw bars
- bars length need to be adjustable
- bar indenting need to be precise
- color need to be programmatic
- we need a label for each bar
First we tried to code bars with background colors and overlay text over background color bar. It was nice, but there was an issue that it need to add several columns to the view. For example for monthly gantt diagram this would be 60 columns, 5 years * 12 months. All these columns also need formulas and so on. Too much typing and not a flexible solution.
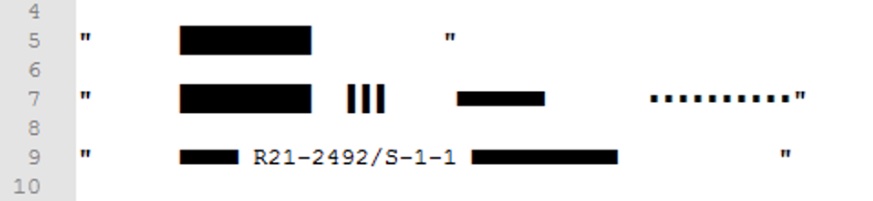
I opted for a bar character (char) with a fixed font. This way indenting was reliable (fixed size) and also bar color and style can be changed. This solution also required only a single column with proper formula. I lost the option for labeling the bar inplace, but a label at the end of the bar is also a nice solution.
Bar indenting
We need to calculate bar indenting that represent start of activity from some start point. For example if project starts on a date A, this is zero offset date. If task starts at date B, this date is offset from the start date for x ticks. Tick is a project time division. If we have many projects, we want to gantt diagrams to start with offset 0. Width of gantt diagram is configured with the UI of the view. For example if we have column with 120 chars length, time division for a 5 year project will be: 60 months / 120 chars = 0.5. So one tick is a half month period. Offset is also calculated based on project length. This way we can normalize project lengths for maximum column width. We could also normalize all projects to longest project or …. Specifics of the view are based on representation requirements, but we are flexible to adjust the gantt view.
calculations:
project_length = end_date - start_date
gantt_tick = project_length / 120
gantt_indent = (Date - start_date) * gantt_tick
gantt_length = min 1: (Duration / project_length) * gantt_tick
I created a sample visualisation with random generated data. It looks nice and most important is that is a usable solution with low maintainance requirements.